

 登录
登录
用一条_______来描述_______的统计图,叫作趋势图.
答案
1. 某校开展读书活动,随机抽取35名学生,对他们在一个月内的阅读情况进行调查,阅读时间 t(单位:h)分为五组 $ \textcircled{1} $ $ 1 0 ≤ t < 2 0 $ $ \textcircled{2} $ $ 2 0 ≤ t < 3 0 $ $ \textcircled{3} $ $ 3 0 ≤ t < 4 0 $ $ \textcircled{4} $ $ 4 0 ≤ t < 5 0 $ $ \textcircled{5} $ $ 5 0 ≤ t ≤ 6 0 $ ,将阅读成绩 a(单位:分)与阅读时间 t(单位:h)制成如下趋势图,如图 12.2-12.
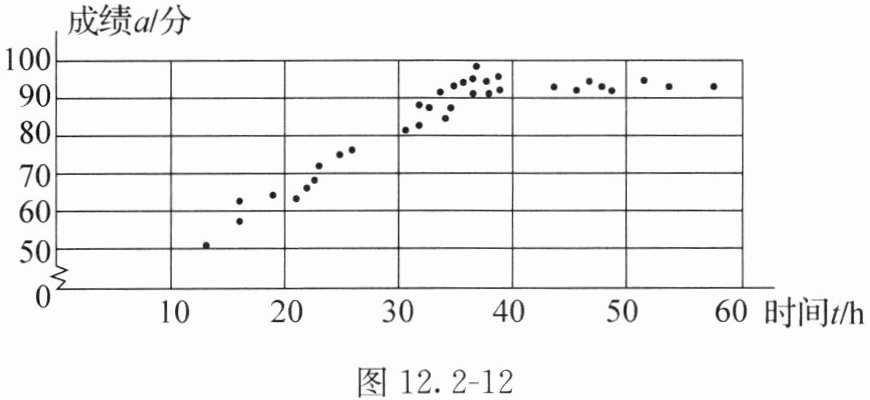
有两种说法:
$ \textcircled{1} $ $ \textcircled{1} $这35名学生中, $ 5 0 ≤ t ≤ 6 0 $且 a $ ≥ 9 0 $的有3人.
$ \textcircled{2} $这35名学生中,成绩最高的在 $ 5 0 ≤ t ≤ 6 0 $时间段内.
其中正确的说法是_______.
有两种说法:
$ \textcircled{1} $ $ \textcircled{1} $这35名学生中, $ 5 0 ≤ t ≤ 6 0 $且 a $ ≥ 9 0 $的有3人.
$ \textcircled{2} $这35名学生中,成绩最高的在 $ 5 0 ≤ t ≤ 6 0 $时间段内.
其中正确的说法是_______.
答案
