

 登录
登录
三、跨学科 扇形统计图 阅读扇形统计图,完成下列各题。
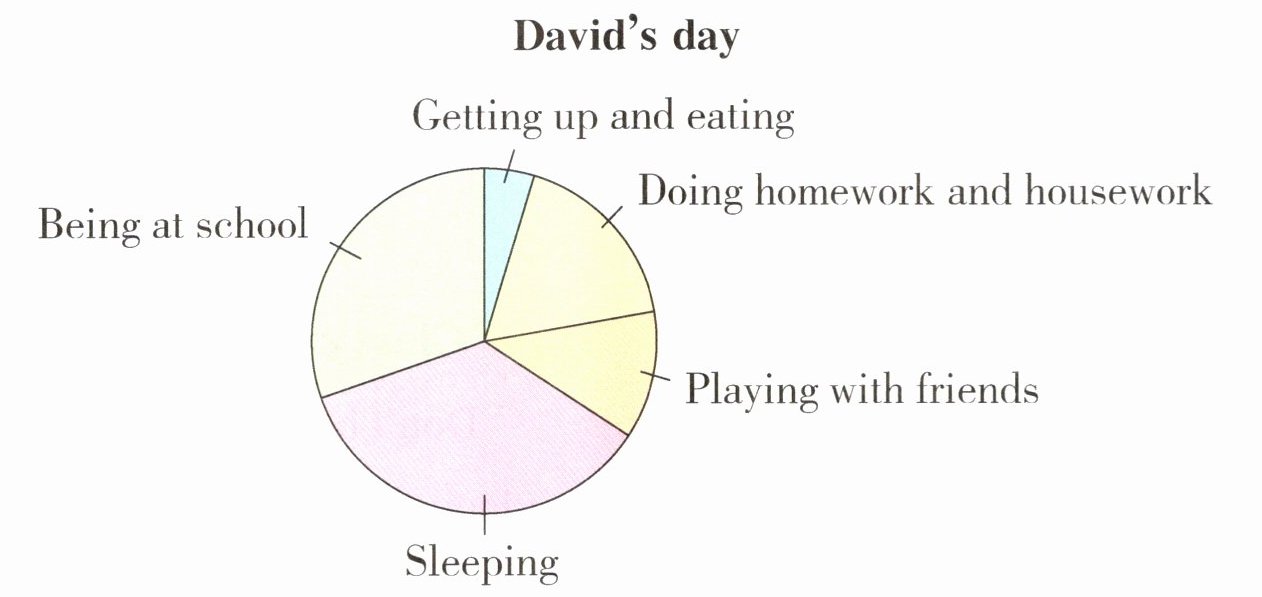
(一)根据扇形统计图,选择正确的答案。
()1. What does the pie chart(图表) show?
A. What David likes to read. B. Who David's friends are.
C. How David spends(度过) a day.
()2. Which activity takes the most time(最多时间)?
A. Playing with friends. B. Sleeping.
C. Getting up and eating.
()3. Which activity takes the least time(最少时间)?
A. Getting up and eating. B. Being at school.
C. Doing homework and housework.
(二)新考法 开放式谈日常 根据实际情况,回答问题。
What do you often do with your friends?
(一)根据扇形统计图,选择正确的答案。
()1. What does the pie chart(图表) show?
A. What David likes to read. B. Who David's friends are.
C. How David spends(度过) a day.
()2. Which activity takes the most time(最多时间)?
A. Playing with friends. B. Sleeping.
C. Getting up and eating.
()3. Which activity takes the least time(最少时间)?
A. Getting up and eating. B. Being at school.
C. Doing homework and housework.
(二)新考法 开放式谈日常 根据实际情况,回答问题。
What do you often do with your friends?
答案
1.C 2.B 3.A
(二)I often play football.(答案不唯一)
(二)I often play football.(答案不唯一)
