

 登录
登录
The following line graph shows the number of cases of X disease in Someland between 1983 and 1992. Write a paragraph about the data and trend for the period from 1988 to 1992. You may refer to the example above.
Number of cases of X disease in Someland between 1983 and 1992
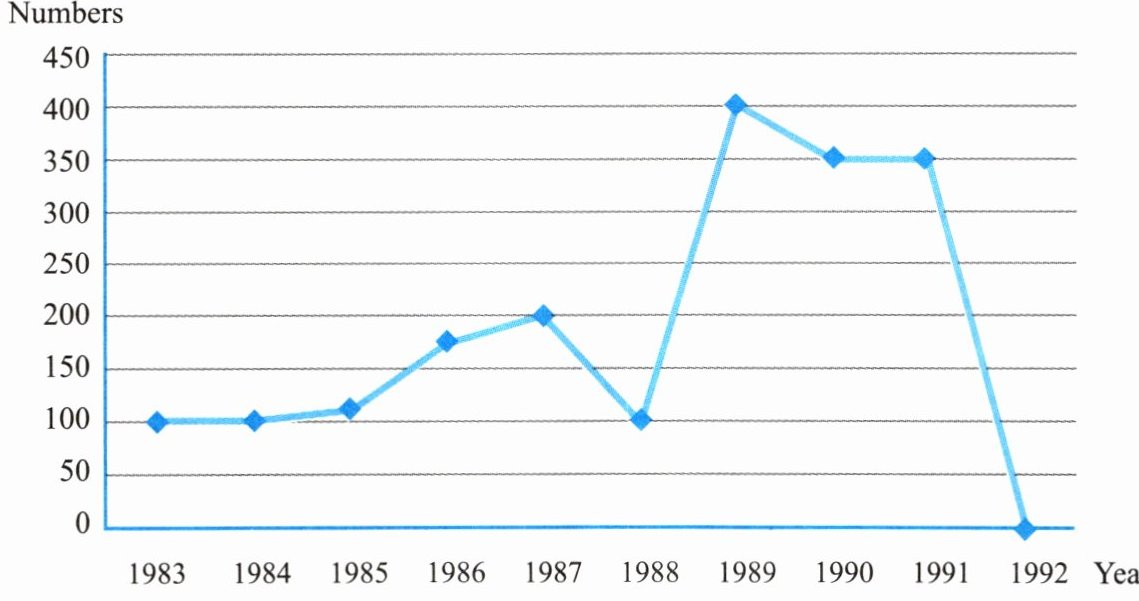
Number of cases of X disease in Someland between 1983 and 1992
Look at the line graph about the number of cases of X disease in Someland between 1988 and 1992. The graph shows that there were 100 cases of X disease in 1988 in Someland. In 1989, the number rose to 400 and then fell to 350 in 1990. In 1992, the number fell again to 0.
答案
Look at the line graph about the number of cases of X disease in Someland between 1988 and 1992. The graph shows that there were 100 cases of X disease in 1988 in Someland. In 1989, the number rose to 400 and then fell to 350 in 1990. In 1992, the number fell again to 0.
解析
【分析】本题要求根据折线图描述1988年至1992年Someland地区X疾病的病例数变化情况。解题时需先定位1988-1992各年份对应的病例数值,再按时间顺序梳理数据的升降趋势,用准确、连贯的英语语句完成段落写作,确保信息完整、表达清晰。
【解析】首先观察折线图,提取1988年病例数为100,1989年上升至400,1990年下降到350,1991年保持350,1992年降至0。随后将这些数据按时间顺序组织成符合要求的段落,准确呈现该时间段内的病例数变化趋势。
【答案】Look at the line graph about the number of cases of X disease in Someland between 1988 and 1992. The graph shows that there were 100 cases of X disease in 1988 in Someland. In 1989, the number rose to 400 and then fell to 350 in 1990. In 1992, the number fell again to 0.
【知识点】英语图表描述、数据提取、书面表达
【点评】本题侧重考查学生对图表信息的提取能力和英语书面表达能力,要求准确描述数据变化趋势,是英语写作中常见的图表类话题,难度适中。
【难度系数】0.5
【解析】首先观察折线图,提取1988年病例数为100,1989年上升至400,1990年下降到350,1991年保持350,1992年降至0。随后将这些数据按时间顺序组织成符合要求的段落,准确呈现该时间段内的病例数变化趋势。
【答案】Look at the line graph about the number of cases of X disease in Someland between 1988 and 1992. The graph shows that there were 100 cases of X disease in 1988 in Someland. In 1989, the number rose to 400 and then fell to 350 in 1990. In 1992, the number fell again to 0.
【知识点】英语图表描述、数据提取、书面表达
【点评】本题侧重考查学生对图表信息的提取能力和英语书面表达能力,要求准确描述数据变化趋势,是英语写作中常见的图表类话题,难度适中。
【难度系数】0.5
